Project: Analyzing 911 calls data
In this project, let us just analyze the 911 calls data available at Kaggle. No machine learning model will be used in this project as we not going to predict anything.
#Imports
import numpy as np
import pandas as pd
import matplotlib.pyplot as plt
import seaborn as sns
%matplotlib inline
sns.set()
#Import data
df = pd.read_csv('911.csv')
#Glimpse of data
df.head(3)
| lat | lng | desc | zip | title | timeStamp | twp | addr | e | |
|---|---|---|---|---|---|---|---|---|---|
| 0 | 40.297876 | -75.581294 | REINDEER CT & DEAD END; NEW HANOVER; Station ... | 19525.0 | EMS: BACK PAINS/INJURY | 2015-12-10 17:10:52 | NEW HANOVER | REINDEER CT & DEAD END | 1 |
| 1 | 40.258061 | -75.264680 | BRIAR PATH & WHITEMARSH LN; HATFIELD TOWNSHIP... | 19446.0 | EMS: DIABETIC EMERGENCY | 2015-12-10 17:29:21 | HATFIELD TOWNSHIP | BRIAR PATH & WHITEMARSH LN | 1 |
| 2 | 40.121182 | -75.351975 | HAWS AVE; NORRISTOWN; 2015-12-10 @ 14:39:21-St... | 19401.0 | Fire: GAS-ODOR/LEAK | 2015-12-10 14:39:21 | NORRISTOWN | HAWS AVE | 1 |
#Data info
df.info()

    <class 'pandas.core.frame.DataFrame'>
    RangeIndex: 639898 entries, 0 to 639897
    Data columns (total 9 columns):
    lat          639898 non-null float64
    lng          639898 non-null float64
    desc         639898 non-null object
    zip          562221 non-null float64
    title        639898 non-null object
    timeStamp    639898 non-null object
    twp          639619 non-null object
    addr         639898 non-null object
    e            639898 non-null int64
    dtypes: float64(3), int64(1), object(5)
    memory usage: 43.9+ MB
#Top 5 zip codes
df['zip'].value_counts().head(5)

    19401.0    43814
    19464.0    42202
    19403.0    33597
    19446.0    31097
    19406.0    21648
    Name: zip, dtype: int64
#Top 5 townships
df['twp'].value_counts().head(5)

    LOWER MERION    53694
    ABINGTON        38554
    NORRISTOWN      36122
    UPPER MERION    34798
    CHELTENHAM      29540
    Name: twp, dtype: int64
#Number of unique title entries
df['title'].nunique()

    147
#Lets create new feature and get the reason from the title column
df['reason'] = df['title'].apply(lambda x:x.split(':')[0])
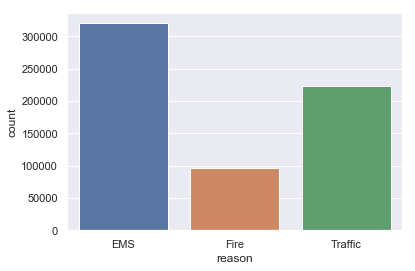
#Most common reason of 911 call
df['reason'].value_counts()

    EMS        320326
    Traffic    223395
    Fire        96177
    Name: reason, dtype: int64
#Countplot of 911 calls by reason
sns.countplot(x='reason',data=df)

    <matplotlib.axes._subplots.AxesSubplot at 0x194000156d8>
#check type of timestamp column
type(df['timeStamp'][0])

    str
#convert timestamp column to datetime type
df['timeStamp'] = pd.to_datetime(df['timeStamp'])
#check type of timestamp column
type(df['timeStamp'][0])

    pandas._libs.tslibs.timestamps.Timestamp
#Lets separate the Hour,Month and Day from timestamp and create separate features
df['hour'] = df['timeStamp'].apply(lambda x:x.hour)
df['month'] = df['timeStamp'].apply(lambda x:x.month)
df['dow'] = df['timeStamp'].apply(lambda x:x.dayofweek)
#lets map the dow to actual day names
dmap = {k:v for k,v in zip([0,1,2,3,4,5,6],"Mon Tue Wed Thur Fri Sat Sun".split())}
df['dow'] = df['dow'].map(dmap)
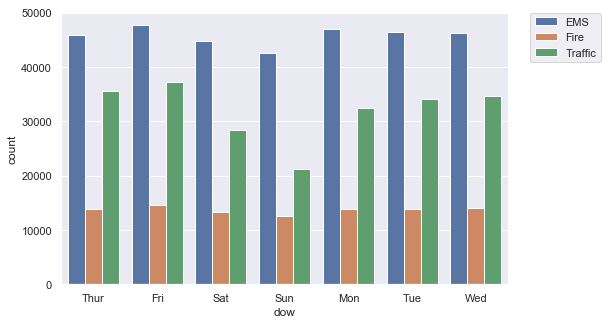
#Countplot on the day of week column with hue on reason
plt.figure(figsize=(8,5))
sns.countplot(x=df['dow'],data=df,hue='reason')

#to get legend out of the figure
plt.legend(bbox_to_anchor=(1.05, 1), loc=2, borderaxespad=0.)

    <matplotlib.legend.Legend at 0x194005f69b0>
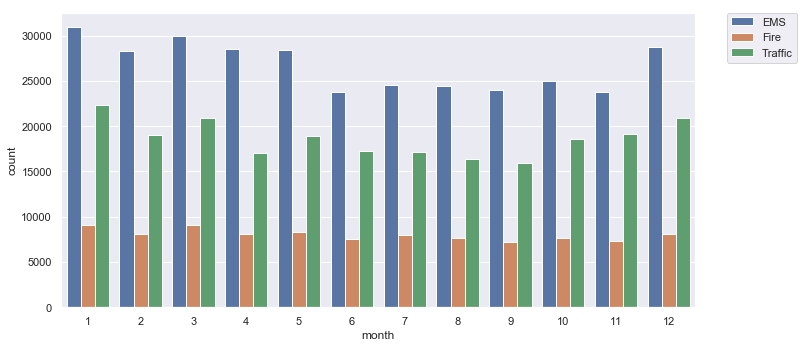
#Countplot on the month column with hue on reason
plt.figure(figsize=(10,5))
sns.countplot(x=df['month'],data=df,hue='reason')
plt.tight_layout()

#to get legend out of the figure
plt.legend(bbox_to_anchor=(1.05, 1), loc=2, borderaxespad=0.)

    <matplotlib.legend.Legend at 0x194006616d8>
#using the Facetgrid to show the same thing in different boxes
g = sns.FacetGrid(df,col='reason')
g.map(sns.countplot,'month')

    <seaborn.axisgrid.FacetGrid at 0x19400643a90>

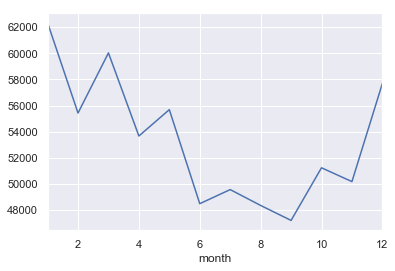
#Line plot showing the number of calls on different months
bymonth = df.groupby(by='month')
bymonth.count()['reason'].plot()

    <matplotlib.axes._subplots.AxesSubplot at 0x19411b1de80>
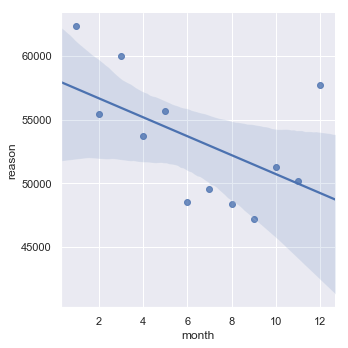
#Linear relation b/w month and number of calls
sns.lmplot(x='month',y='reason',data=bymonth.count().reset_index())

    <seaborn.axisgrid.FacetGrid at 0x1940ca81828>
#creating a new date column
df['date'] = df['timeStamp'].apply(lambda x:x.date())
#Creating the plot for number of calls per date
plt.figure(figsize=(15,5))
df.groupby('date').count()['reason'].plot()
plt.tight_layout()

#Creating the plot for number of calls per date for traffic reason only
plt.figure(figsize=(15,5))
df[df['reason']=='Traffic'].groupby(by='date').count()['reason'].plot()
plt.title('Traffic')
plt.tight_layout()

#Creating the plot for number of calls per date for EMS reason only
plt.figure(figsize=(15,5))
df[df['reason']=='EMS'].groupby(by='date').count()['reason'].plot()
plt.title('EMS')
plt.tight_layout()

#Creating the plot for number of calls per date for Fire reason only
plt.figure(figsize=(15,5))
df[df['reason']=='Fire'].groupby(by='date').count()['reason'].plot()
plt.title('Fire')
plt.tight_layout()

#Creating heatmap between day of week and hour to check at which hour of the day we got the most calls
day_hour = df.pivot_table(values='reason',index='dow',columns='hour',aggfunc='count')
plt.figure(figsize=(10,5))
sns.heatmap(day_hour,cmap='magma_r')

    <matplotlib.axes._subplots.AxesSubplot at 0x19417237fd0>
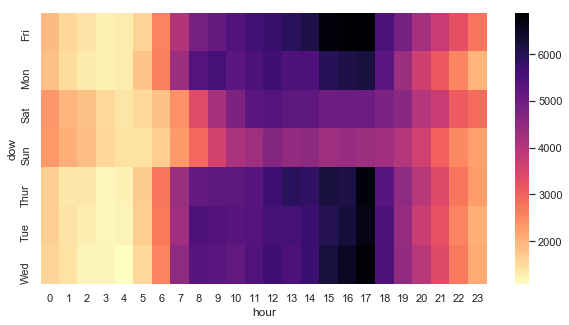
Looks like we get the most calls around 3pm to 5pm on weekdays only. On weekends, it’s more calmer out there.
month_day = df.pivot_table(values='reason',index='month',columns='dow',aggfunc='count')
plt.figure(figsize=(10,5))
sns.heatmap(month_day,cmap='magma_r')

    <matplotlib.axes._subplots.AxesSubplot at 0x19413337da0>
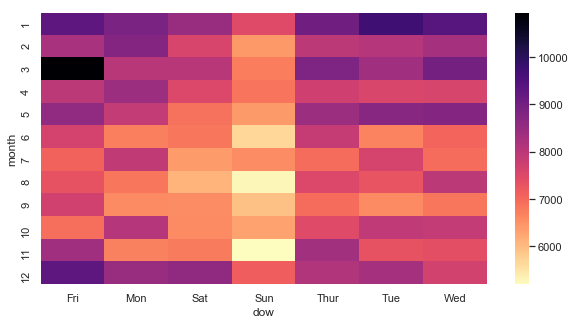
Looks like we got the most calls on Fridays in march.
Leave a comment