Understanding expected values
Let us visually understand the concept of expected values in python. For this we will be using the famous example of rolling two fair dices and recording their sums.
Lets define a discrete random variable X, that will hold all the possible outcomes of our experiment.
#These are all the outcomes that we can observe once we roll two fair dices and record their sum
X = [2,3,4,5,6,7,8,9,10,11,12]
#Lets define the probability of each outcome
P = [1/36,2/36,3/36,4/36,5/36,6/36,5/36,4/36,3/36,2/36,1/36]
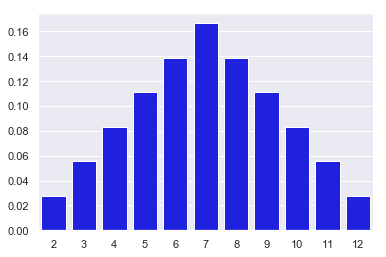
#Lets plot the outcomes vs probability of each outcome
sns.barplot(x=X,y=P,color='Blue')
    <matplotlib.axes._subplots.AxesSubplot at 0x20b777c57f0>

#Lets calculate the expected value
sum([x*y for x,y in zip(X,P)])
    6.999999999999999
Which doesn’t mean that the expected value that we are going to get is 7 when we roll two fair dices and record their sum but what that actually means is that if we roll the two dices a large number of times and record their sums each time, on average we are going to get a 7 value. Let us prove that as well with the help of python.
#Necessary imports
import pandas as pd
import numpy as np
#Define our dice
dice = pd.DataFrame([1,2,3,4,5,6])
#Experiment: Let us roll the two dices around 10000 times and record their sum
sum_of_rolls = [dice.sample(n=2,replace=True)[0].sum() for x in range(10000)]
Let us now check the mean value from our experiment above
np.mean(sum_of_rolls)
    7.0103
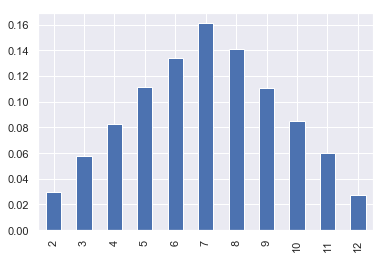
See, we got the value 7. Not only that, but if we plot the probability of each sum that we observed in the experiment, it would be very close to the true probibilities.
#Total number of trials is 10000
((pd.DataFrame(sum_of_rolls)[0].value_counts()/10000).sort_index()).plot(kind='bar')
    <matplotlib.axes._subplots.AxesSubplot at 0x20b771cb080>

You can see that these probabilities are very close to the original probabilities in fig 1.
Leave a comment